The Most Expensive AI Errors Are Made of True Numbers
Two months auditing an AI research agent. Nine ways a true number lies, and the check that catches each.
For three days in May, every pre-earnings brief our research agent produced on NVIDIA was anchored to one number: $68.1 billion, presented as the market’s consensus for the next quarter. The agent reasoned from it carefully. A beat is priced in, meaning the market already expects the target to be cleared. The bar sits here. Watch the guidance, then the reaction.
The number was real. NVIDIA had reported it the previous quarter. It was the last quarter’s actual revenue, and the agent had dressed it as the next quarter’s forecast. NVIDIA’s own published outlook for the quarter the agent was forecasting was $78.0 billion, nearly $10 billion higher, so every brief built on that anchor was aimed at the wrong bar.1 Three days of confident, internally consistent, well-written analysis, wrong at the root. And the root was not a lie; it was a real number in the wrong tense. Some failures in this record invented a part outright. But the errors that survived longest took a real number and attached the wrong period, scope, label or authority to it.
I run an autonomous research agent inside a large personal knowledge system, and for two months I checked what it told me at every layer: individual claims against the strongest sources reachable, filings and earnings releases and the survey publishers’ own pages; whole documents against a gate that decides what enters the knowledge base; the agent’s own confidence labels against independent reviewers. Everything got logged. This piece is that record, and the field guide that fell out of it: the nine failure modes this audit exposed, many of which ordinary claim-level fact-checking misses, a real specimen of each from our logs, what each one looks like in an ordinary chat window, and the cheap check that catches it. At the end there is a method, and a tool, for building the same trust table for your own AI.
The headline is the part I did not expect. Checked claim by claim, the agent was largely right. Checked at the level of what deserved to enter what I know, almost everything died. Those two results are about different things, and the gap between them is where the money goes.
What we ran, and what checking means here
The agent is the same one from How Reliable Is Your AI Agent?, the 91% piece: a Hermes-framework agent on a deliberately cheap model, running unattended on a rented server, researching markets and AI. It writes into a knowledge system of more than 16,000 notes. The standing rule: nothing it produces enters the canonical layer without surviving a check it cannot influence. Claims get sampled against the strongest sources reachable. Documents queue at a gate where a duplicate check and a human decide what gets through. Its confidence labels are read as text, never as evidence.
If you work in a chat window rather than a pipeline, you own the same architecture without the vocabulary. The moment you copy an AI answer into your notes, your plan, or your codebase is your promotion gate. The only question is whether anything stands at it.
Before the numbers, the scope. This is one agent, one model, one system’s gates, over one two-month window, 9 May to 13 July 2026. Every percentage below is local. Your model is probably better than ours. Your corpus and your review habits are different, so your rates will differ, and I will flag the direction where I can. What transfers are the failure classes and the checks. And one result transfers with special force: the accuracy numbers below came from a cheap model, and accuracy was not the main thing killing its output. Redundancy and expiry were, and those are properties of your corpus and your calendar. Upgrading the model alone does not fix the survival problem.
The scoreboard: four gates, four denominators
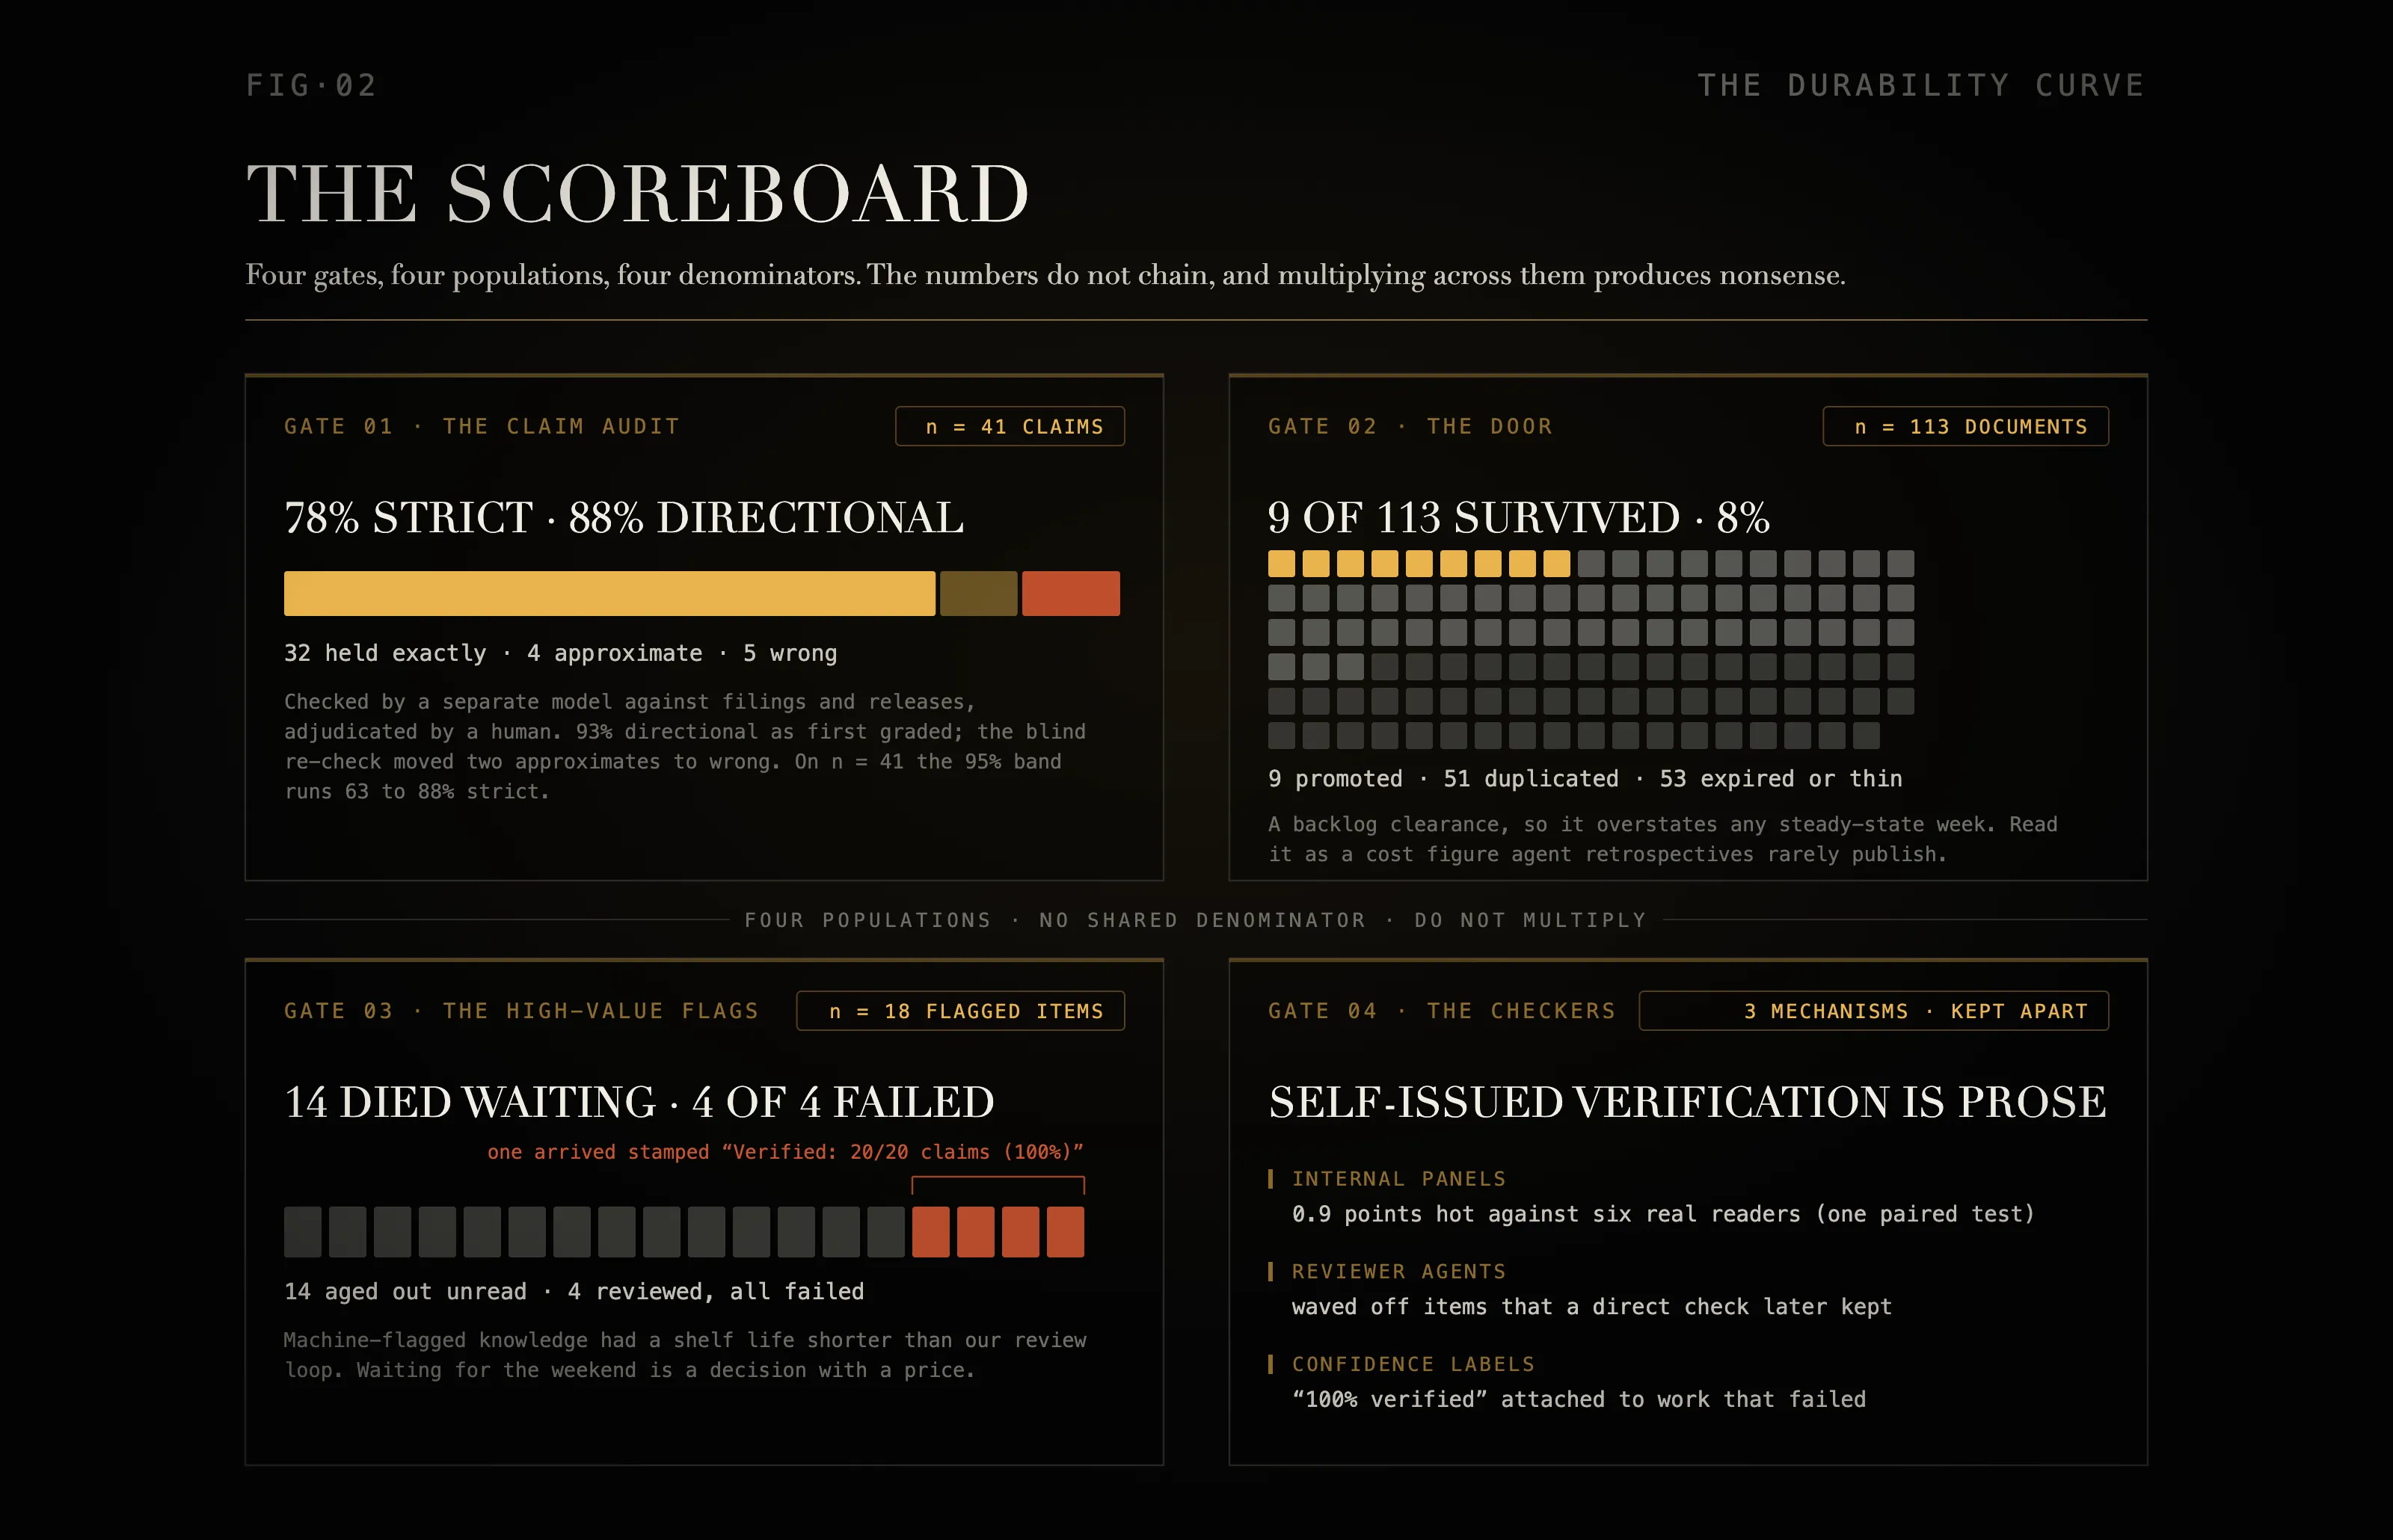
These are four separate measurements on four different populations, taken as the work happened. They do not chain into a single funnel, and multiplying across them produces nonsense.
The claim audit
In May we pulled 41 discrete factual claims from the agent’s research output, across two audits five days apart, and checked each against the strongest source reachable: SEC filings, earnings releases, official statistics, the trade press where nothing better existed. The checking ran on a separate model with web access, never the agent grading itself, and I adjudicated the verdicts. 32 held exactly. 6 more we graded approximate at the time, right in direction and wrong in precision. 3 were materially false. As first graded, that is 78% strict and 93% directional. Then the blind re-check described later in this piece re-examined 8 of the 41 and moved two of those approximates to wrong, which takes the directional rate to 88%. Only 8 were re-checked, and both moves went the same way, so treat 88% as the ceiling on what a fully blind pass would have returned rather than as a corrected figure. The strict rate does not move.2 The anatomy of the misses matters more than the rate. No invented companies. No invented events. No inverted conclusions. Where invention appeared, it was one level down: sub-category splits and secondary ratios the source never published, riding on top-line stories that checked out. The failures were dates, staleness, scope, and structure: the classes in the field guide below.
The door
Over the same two months, the agent staged 113 documents for promotion into the knowledge base. 9 made it. 104 went to the archive. 45% of the queue, 51 items of the 113, duplicated something the system already held. The rest had expired before review or were too thin to keep. Three concessions before you quote that number. We capture aggressively by policy, so our net catches more junk than a stricter pipeline would. This was a backlog clearance, so it overstates any steady-state week. And a share of the expiry is on us, because the queue outlived our review loop. Read it as a cost figure, and it is a cost figure agent retrospectives rarely publish: autonomous capture into a mature corpus yielded single-digit percent durable knowledge, and the triage burden scaled with volume, no matter how accurate the individual sentences were.
The high-value flags
18 items the agent had marked as significant knowledge sat in review for more than a week. 14 died of age before a human read them. That one is a finding about us, and probably about you: machine-flagged knowledge had a shelf life shorter than our review loop, which means “I’ll review it at the weekend” is a decision with a price. The other 4 were the queue’s most substantial research, each carrying its own verification claim, one of them a literal “Verified: 20/20 claims (100%)”. All four failed the promotion gate. Four of four. One had confabulated a specification date. One reported the star-counts on software projects, GitHub’s popularity number, wrong by 2 to 3 times under the label “100% verified”. One was titled “Verified Incidents” and sourced its numbered security vulnerabilities to personal blogs. One duplicated work the system already trusted.
The checkers
Three separate failures, three different mechanisms, and they deserve to be kept apart. Our internal review panels, scored against a six-reader focus group, on the same essay of ours, ran 0.9 points hot on a 10-point scale: one paired test, so treat it as an anecdote, not a benchmark. A batch of reviewer agents we ran over the queue waved off items that a direct check later kept. And the labels: in two months of logs, “100% verified” appears attached to work that failed verification. One stamped draft restated an analysis that had been updated 11 minutes earlier. Another asserted it had checked the vault for duplicates and found none, the same day its duplicate went live. That second agent had not run a check and reported a result. It had authored the sentence a check would produce.
Accuracy is a property of sentences. Survival is a property of what you can safely build on. Our agent scored well on the first and brutally on the second, and almost none of the gap was made of lies.
Agent retrospectives usually report task success: did it finish, did the code merge, did the pipeline run. I have not seen anyone publish the other axis, the one this record measures: of everything the system said, what deserved to enter what you know? The accuracy metric collapses every failure into a single verdict, wrong. The survival failures have shapes: nine, in three families, each with its check.
The field guide: nine failures, three families
I started calling them assembly errors, because the defect lives in how the pieces are joined. In most classes the parts are true and the claim is not: a real number in the wrong tense, a real figure pinned to the wrong scope. In the mirror classes the whole is true and the model authors the parts to fit: a real total decomposed into an invented breakdown, a verification sentence written rather than run. Fluent models produce both at volume, they sail through the lie-detector posture most people bring to AI output, and each falls to a specific, cheap check that has nothing to do with asking the model whether it is sure.
The split also explains which errors got expensive. Every authored part in these logs failed its first outside look; the errors that ran for days and became foundations were assembled from parts that were individually true. A fabricated part usually fails the first look from outside. A true part passes every look except the one at the joints.
The three families: errors of time, errors of shape, errors of trust. One entry in full first, free, because it is the one I most often watch people build on.
The invented breakdown
The specimen: asked why communities oppose data centres, the agent reported Gallup’s polling as water 35%, electricity 28%, noise 18%, property values 12%. Gallup’s real survey put water at 18% and energy at 18% among opponents, inside a different category scheme where respondents could name more than one concern.3 None of the agent’s four category-and-number pairs appears on the page. Gallup has no property-values line at all, and the noise it does report sits inside a 16% pollution category. The top-line story was right. The decomposition was authored by the model, category names and all, because a decomposition is what the question demanded and the source did not supply one.
In a chat window this is the five-part market breakdown with tidy percentages. The four-stage version of your own method, when you wrote five. The “three drivers of churn in businesses like yours”. Structure is what a builder most wants to hear, so structure is what the model gives you when the source runs out.
The check, once a source is in front of you, takes under a minute: ask where the table is. A breakdown is only as real as the source’s own table, and if the source has no table, you are reading fiction with a true headline. A real total does not vouch for its parts.
Footnotes
-
NVIDIA, “NVIDIA Announces Financial Results for Fourth Quarter and Fiscal 2026”, 25 February 2026. Record quarterly revenue of $68.1 billion for the quarter ended 25 January 2026, against an outlook for the following quarter of “$78.0 billion, plus or minus 2%”: a gap of $9.9 billion. The figure quoted here is NVIDIA’s own outlook rather than analyst consensus, which has no stable primary source to point you at. NVIDIA went on to report $81.6 billion for that quarter on 20 May 2026, so $9.9 billion is the conservative way to state the error. ↩
-
32 of 41 strict is 78%, with a 95% Wilson interval of roughly 63 to 88%. Directionally, 38 of 41 as first graded is 93% (roughly 81 to 97%); after the blind re-check moved two approximates to wrong, 36 of 41 is 88% (roughly 74 to 95%). The intervals overlap almost entirely, which is the honest reading of a sample this size: the counts are the finding, the third decimal place is not. ↩
-
Jeffrey M. Jones, “Americans Oppose AI Data Centers in Their Area”, Gallup, 13 May 2026. Respondents opposing a local data centre could name more than one concern, which is why the categories do not sum to 100. ↩