Where Your Metrics Fold
A metric can be perfectly accurate and still hide the distinction your decision depends on.
A metric can be perfectly accurate and still hide the distinction your decision depends on.
The dashboard read 87 percent complete, and it was right: 87 percent of the scheduled tasks for the launch were genuinely done, ticked off, verified. The board did its job. Then the launch slipped by six weeks, and in the post-mortem someone put that same 87 percent back on the screen and the room went quiet, because nothing about it had been wrong.
Look at what the number saw and what it could not. It observed completed work, accurately. From that, everyone in the room inferred the launch was on track. What it left out was where the unfinished 13 percent sat: almost all of it behind a single unresolved dependency on the critical path, the one piece everything else was waiting on. A project with its hard problem solved and a project with its hard problem untouched both report 87 percent complete. The reading was true. It simply could not tell those two projects apart, and they needed opposite decisions.
The failure did not live in the measurement. It happened in the instant the situation was flattened into a single number.
That flattening has a shape, and once you can see it you can find where a number is most likely to mislead you, on one you already own, before anyone optimises anything.
Name the collision
A scalar metric is a lossy projection. It takes a reality with many dimensions and presses it down to one value, and what the pressing throws away cannot be recovered from that value alone. When many dimensions map to one, distinct states end up sharing a reading. Two situations you would treat differently produce the same number.
Call any decision-relevant collision a fold: two states that receive the same value but would demand different actions if you could see them apart. The 87 percent was a fold. A perfect sensor reading exactly what it was designed to measure can still fold, because the loss happens when that measurement is used to stand in for a larger decision.
Take a customer rating sitting at 4.7. In one store almost everyone rates it between 4 and 5. In another, most customers give it 5 while one strategically important segment consistently gives it 1, and the two average out to the same 4.7. Both readings are honest, drawn from complete data. One store has broad satisfaction. The other has a concentrated failure hidden inside an excellent mean, and the number gives you no way to tell which store you are running.
Now do it on your own number. Pick one you are judged by. Write down two situations you would respond to differently that would show up as the same value. That pair is a fold, and notice what was not in the room while you found it. No incentive, no gaming, no adversary. The blind spot was already there.
You can often read a fold off the number’s own definition, with nobody pushing on it.
Four kinds of fold
Folds are easier to hunt once you know what a number tends to lose. Four useful kinds cover many of the folds you meet in practice.
A composition fold hides different groups behind the same average. The 4.7 that is broadly fine and the 4.7 that hides a segment stuck at 1 star are the same point. Statisticians know an extreme special case as Simpson’s paradox, where the aggregate can run opposite to every subgroup inside it.
A trajectory fold hides direction behind a level. Monthly churn of 5 percent can be steady, recovering fast, or coming apart, and this month’s number reads identically in all three.
A structure fold hides where the value sits behind a total. The project that is 90 percent complete with the critical path finished and the one that is 90 percent complete with every hard dependency still open share one headline.
A mechanism fold hides how the result was produced. The same quarterly profit can come from stronger customer economics or from deferred maintenance and postponed investment, and the profit line looks identical either way.
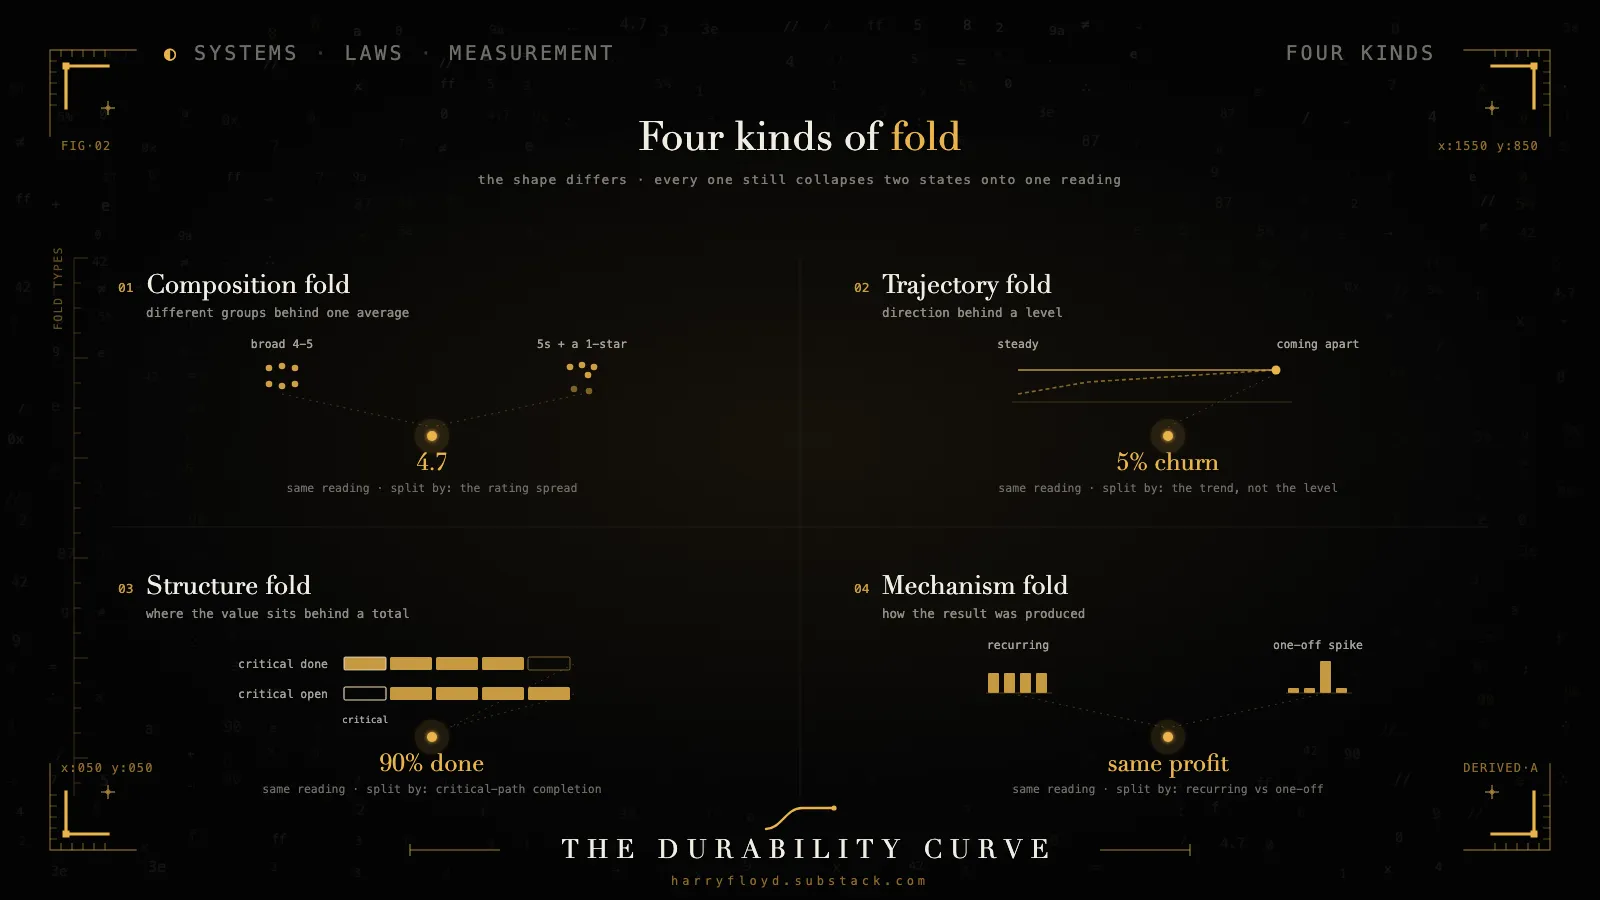
Four questions to run at any number: what it is made of, which way it is moving, where the value is concentrated, and what produced it. Each names a dimension the number quietly averaged away.
Folds are where the effort flows
This would stay a curiosity if folds were rare corners you might wander into. They are where effort flows. You often cannot move the outcome you want directly. You move the number you can see, and the cheap way to move it runs straight through a fold. Nudging an already-satisfied majority from 4 to 5 may be cheaper than repairing the experience of the segment stuck at 1 star. Both lift the average. Only one closes the concentrated failure the mean was hiding. This is one of the recurring mechanisms behind benchmarks that come apart once people start optimising against them. Once a score is the thing people are paid to move, the shortest path to the score and the shortest path to the goal stop being the same path.
Capability does not save you here. The more capable the optimiser, the more thoroughly it searches the states that score well, and when the score has folds that thoroughness cuts both ways: capability expands the search for shortcuts as well as solutions.1 Watch it in machine evaluation. A coding benchmark can hand two systems the same score on isolated fixes when only one of them can sustain work across files, tests, and intermediate decisions. The score was not false. It folded together the system that could carry the wider process and the one that could not, and that fold is exactly where a capable optimiser lands.2
The fold comes before the pressure
By now you may be filing this under Goodhart’s law. When a measure becomes a target, it stops being a good measure.3 But look again at what you did a few paragraphs ago. You found a fold in your own number before any optimiser entered this argument, before anyone was pushing on anything. Goodhart tells you that optimisation can separate a measure from the goal it represents. The fold was there before any optimisation, sitting in the number’s structure, waiting. The fold-map asks the prior, operational question: which different realities does your measure already treat as the same? Find those collisions in advance and you know where to watch once targeting pressure arrives.
The number does not have to lie to mislead the decision.
Draw the map
So map it. Take your one number and write the question you believe it answers. Then look for one fold of each kind. For every fold you find, fill six columns: the metric, state A, state B, the reading they share, the different decision each would call for, and the one signal that would separate them.
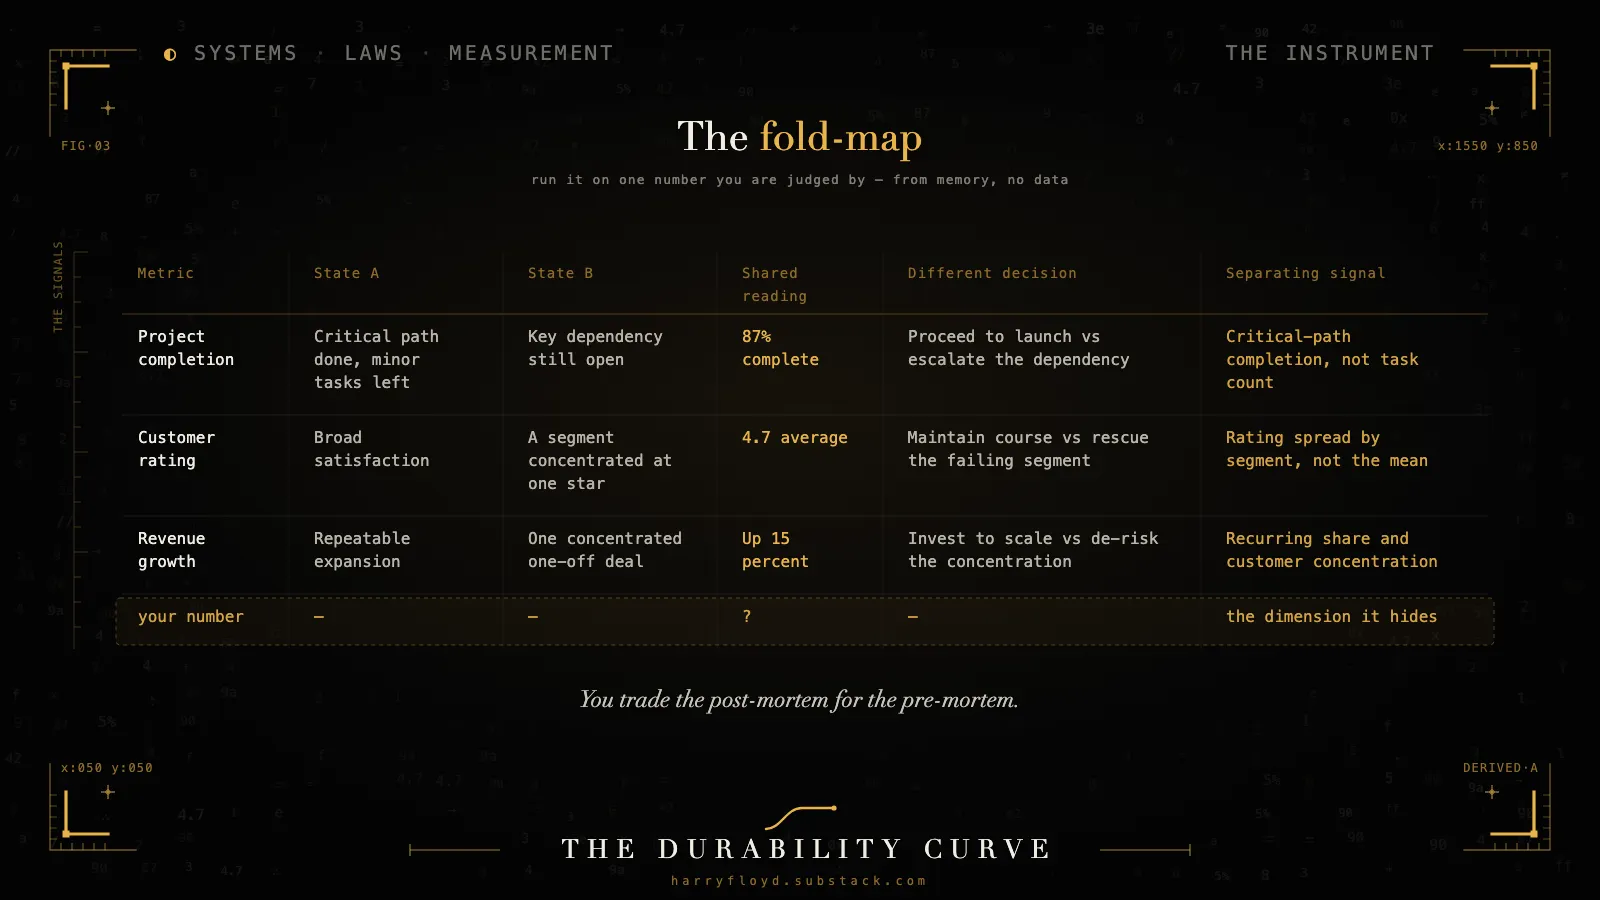
Then rank the folds by the cost of confusing the two states, how likely that confusion is, and how cheaply an optimiser could produce the misleading one. Prioritise the folds that combine severe consequences, plausible confusion, and a cheap path to the misleading state. For that one, the basic repair is to start watching its separating signal alongside the number. That does not recover everything the projection lost. A mean plus a variance still cannot rebuild the whole distribution.4 It splits the one collision you care about most, which is enough to act on.
Every important number should get this treatment before it reaches a dashboard. It takes ten minutes, and it turns part of the post-mortem into a pre-mortem: the likely failure sites, named before the failure instead of after.
Run it tonight on one number you are judged by. Write two situations that score the same, name the decision each would change, and start watching the signal that tells them apart. You may not find a fold of all four kinds the first time. The empty rows are the reward: they mark the parts of your number you have never inspected.
Which number do you steer by that you have never checked for a fold, and what do you now suspect it has been hiding?
Footnotes
-
DeepMind’s safety team keeps a documented catalogue of systems that satisfied the letter of their objective while defeating its intent, from a simulated boat circling for points instead of finishing the race to agents exploiting game bugs: “Specification gaming: the flip side of AI ingenuity” (2020). ↩
-
The gap is measured. As of mid-2026, frontier models that resolve over 70 percent of SWE-bench Verified’s single-issue fixes drop to roughly 23 percent on SWE-bench Pro, whose tasks demand larger changes across multiple files in professional repositories. The easier score had folded the two capabilities together. ↩
-
The familiar phrasing is not Goodhart’s. Charles Goodhart’s 1975 observation concerned monetary targets; the general version is the anthropologist Marilyn Strathern’s, from “‘Improving ratings’: audit in the British University system” (European Review, 1997): “When a measure becomes a target, it ceases to be a good measure.” ↩
-
Francis Anscombe built four datasets with identical means, variances, correlations, and regression lines that graph into wildly different shapes: “Graphs in Statistical Analysis” (The American Statistician, 1973). Four different realities, one set of readings: the fold, drawn half a century early. ↩